Unit 9: 1950s & 60s
Timeline
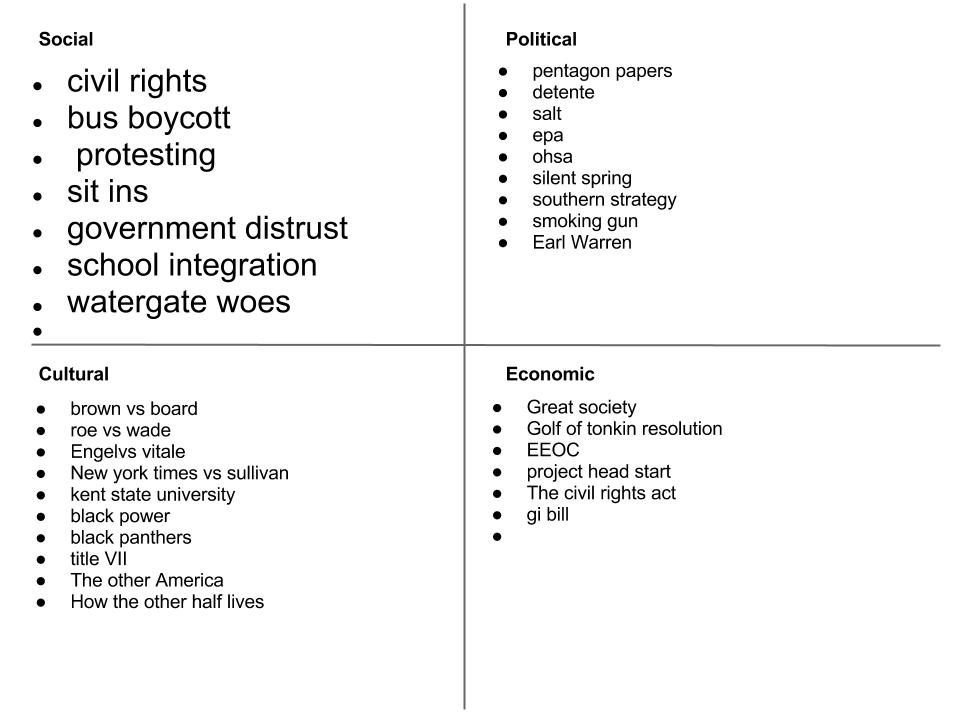
4 Worlds
Primary Sources
Birth rate chart This is a chart of America's birth rate from 1940 to 1960. The chart depicts an increasing line with few declines.
This graph is signigicant because it illustrates the baby boom after WWII. Once all of the soldiers returned from war, celebrations were in order, thus the population spike. Rachel M. |
"What I Tell My Chiled About Color This is about two different families with sons about the same age. The difference being one family is black and one family is white. Each of the boys start making inquiries about the inconsistencies that reside between the black and the white children and their parents are faced with the difficult task of explaining segregation without encouraging bigotry, prejudice, and racism.
This story is significant because it shows how sponge-like and receptive children are to the hate that swirled around them. This shows how prevalent racism was in the 1950's and how it affected young people. Shayla C. |
Summer of Love This is 10 different accounts from 10 men and women that packed up their lives and went to San Francisco to experience the Hippie movement and the summer of love.
This is significant because it shows where teenagers and young people in this country stood for, like a world without war and legal marijauna. It shows what young people felt strongly about and even though they may have gotten high periodically, it doesn't mean that their views weren't important. Jared C. |
Moon Landing This is an audio clip of Neil Armstrong stepping foot on to the moon and saying the famous words "One small step for man... on giant leap for mankind."
This is significant because it encompasses the meaning of the space race and how quickly science was advancing. Sending a man to the moon asserted the United States' dominance in science and technology, effectively beating out the Soviet Union. John M. |
